
|
|
 |

| |
|

|
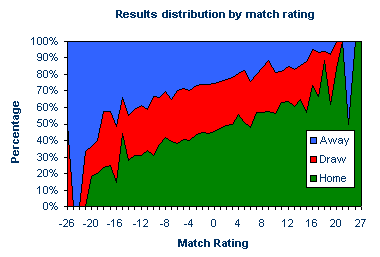
Rating Systems & Probability To make betting predictions from match ratings they must in some way be translated into a probability distribution for the possible results in a sporting contest. Goal difference, for example, provides one measure of the dominance of one football side over another in a match. The assumption for a goals superiority rating system, then, is that teams who score more goals and concede fewer over the course of a number of matches are more likely to win their next game. That is to say, their match form, in terms of scoring and conceding goals, is potentially better than those teams with a lower rating by this reckoning. The number of past matches for which a goals superiority rating may be calculated is not entirely arbitrary, requiring a judgement by the punter on what constitutes the best choice for the number of matches to describe recent form, from the perspective of determining the best forecasting model for match prediction. Using results data for the English Premiership and Divisions 1, 2, and 3 for seasons 1993/94 to 2000/01, goal supremacy ratings based on the most recent 6 matches played by every team have been calculated. For each match, the ratings of the home and away team are simply the total number of goals scored (home and away) minus the total number of goals conceded, in the 6 preceding games by the home and away team respectively. The match rating, then, is the home team rating minus the away team rating. Of the 16,272 matches played during these 8 seasons, 14,002 of them were eligible for a rating calculation, with the matches played in the first 6 rounds of each season obviously unsuitable for this recent form analysis. The precise distribution of results according to their match rating is shown below.

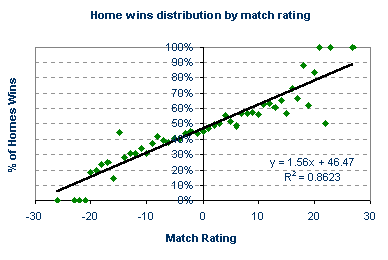
Since we have calculated a home-win, draw, away-win probability distribution for every match rating, we could use these historical data to predict the most likely result for any future match, provided at least 6 games have been played in the season in order to describe the recent form. According to the data, a match rating of +12, for example, would have a 63% chance of ending with a home win, whilst another game rated at -12 would give the away team a 39% expectancy of victory. In general, the higher the match rating, the greater the probability of a home win. Conversely, the lower the rating, the greater the chance for an away win. It is initially not obvious how the match rating influences the likelihood of a drawn game. But what about a rating of +15? Surely one might expect the chance of a home win to be greater than that for a match rating of +12, and yet only 57% of games rated +15 finished with such a result. Similarly, only 34% of games rated -15 finished with an away success. Of course, these discrepancies arise because the relationship between the match rating and the home-win, draw, away-win probability distribution is inherently "noisy" and imperfect. Such discrepancies become more apparent for the extreme ratings for which, owing to the limited amount of match data, one or two results have a much greater influence on the results probability distribution, as illustrated in the figure above. To accommodate this variance, we need to standardise our forecasting model. By doing so, we can then make a practical attempt at defining the fair odds for a football game. The first task is to consider each result independently, and identify the "best-fit" relationship with the match ratings. The easiest way to determine this best-fit relationship is to redraw the ratings-probability data as three separate scatter plots, one for each result. For each scatter plot, the best-fit line can then been superimposed on the data points, representing what would statistically be considered to be the best relationship between match rating and result probability. This has been done for home wins below.

The equation for each best-fit line can also be easily calculated with appropriate software like Microsoft Excel or SPSS. For each equation, y, the probability of a particular result occurring is some function of x, the match rating. For home wins this y = 1.56x + 46.47. The value of R² shown in the scatter plot is simply a statistical measure of how closely the real data match the idealised trend line. A perfect relationship is denoted by R² = 1. Consequently, a fairly good relationship exists between the match rating and home win probability, where as much as 86% of the variation in the real data is explained by its best-fit equation. For away wins and draws, the relationship is invariably much weaker whatever the rating system under investigation. Naturally, this will have implications for use as predictive tools for betting purposes. With the best-fit equation y = 1.56x + 46.47 we can easily determine the expected probability of a home win for any match where we have calculated the goal supremacy rating. A game with a match rating of +10, for example, has a 62.1% likelihood of ending with a home win, whilst one rated at -7 has a 35.6% chance. To calculate these percentages, all we need to do is input the match rating into the best-fit equation. With an estimation of the true expectancy for a home win, we can define the fair odds for a home win. The fair odds for a match rating of 0, for example, are 2.15, or 100% / 46.47%. We can define fair odds for the away win and draw in the same way, using the best-fit equations for away wins and draws, although their accuracy will be lower than for home win prediction. With an idea about the true chances of a result occurring we can then begin to identify any bookmaker's mistakes and value in their betting odds. |

|